Option 1 – Measure the Complete Response Curve (0 – 100%) “Known as the “Complete Response Time”
One option for the OSRTT tool is to consider the FULL transition time, the time it takes to fully change from one shade to another. This would be represented on the response curve graph as follows, measuring between the blue and the red lines without any tolerance baked in. It is the total time taken to fully change from the starting grey shade, to the target grey shade. 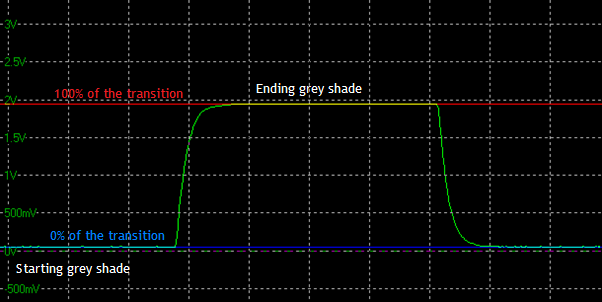
This may be favoured by some people as a measure of the full transition time – but we cannot call this the “response time” really as that’s not what we are measuring any more. The recommendation is that if this data is to be used and presented, this should really be labelled as the COMPLETE RESPONSE TIME
Some people may prefer this approach as a very strict measure of the total time it takes to switch from one shade fully to another. However, there are some limitations with this approach:
There is no consideration for when a transition has reached “close enough” to the target colour and so is visually indistinguishable. Is it fair to measure the curve to where it has to reach the final end shade if it got visually to the same thing much sooner? You will see how the response curves taper off when it gets close to the end points of the transition. The real question is how close does it need to get to visually represent the completion of the transition?
Some screens show a particularly long taper at the end of a transition as it finishes that last little bit. In some extreme cases if you were then measuring this “total transition time” it would extend the response time to maybe 20ms+. Is it fair to do that when it actually reached 90% or even 95% of the way there, and looked visually the same?
Note: Where overshoot is present (discussed later) the “complete transition time” will incorporate this as well, as it measures the time it takes to get to the final RGB state AFTER the overshoot has happened. This will also add significant time to the G2G measurement. This is discussed more later, but it’s important to keep in mind for these measurements.
There is perhaps merit and interest in capturing this “complete response time” for some users, but we also need to also keep in mind what we are ultimately trying to achieve here – and that is to provide a measurement that is representative of how the display appears visually to the user. As a result we do not recommend using the ‘total response time’ as it is overly strict and prone to causing unfair measurements.
Note that if you do want to use this data, is is captured by default in the OSRTT output data CSV files as “complete response time”, you do not need to select that in the software, it will always be included.